Why, and Where, are Housing Prices Rising?
Tufts University
The Issue:
The price of housing has a special importance because housing is both a basic necessity and a key component of wealth. Around the start of the pandemic, some experts predicted a protracted collapse in housing prices and the housing market. For example, in April 2020 the staff at Freddie Mac projected home prices would fall by 0.5 percent over the next year. In fact, the opposite happened: The Case Shiller National Home Price Index rose by 15 percent between April 2020 and April 2021 while home sales hit a 15 year high in the calendar year 2021. This stands in stark contrast to the Great Recession when the price index fell 44 percent between May 2007 and May 2009. But one similarity across the Great Recession and the COVID downturn is the wide differences in housing price changes across different parts of the United States. What has happened to housing prices during the COVID pandemic and why? And what are the broader economic implications of this?
Real house prices shot up by 20% between February 2020 and September 2021 in the US. But the degree of appreciation has varied greatly across cities.
The Facts:
- House sales and housing construction fell at the outset of the pandemic in March 2020. The total housing inventory on the market, including newly constructed houses and those being resold, was down 10.2 percent between March 2019 and March 2020. Between February 2020 and March 2020 housing starts declined by 22.3 percent, perhaps reflecting builders’ bleak expectations for future demand. Total existing-home sales fell 8.5 percent in March 2020 compared with the prior month and tumbled a further 17.8 percent in April.
- There has been a 20 percent rise in housing prices relative to the overall inflation rate since the onset of the pandemic. The year-on-year rate of increase of the Case-Shiller Housing Price Index was 2.4 percentage points higher than the inflation rate of all other goods and services in February 2020. This differential, the real (i.e. inflation adjusted) annual house price growth rate , widened since then and was more than 13 percentage points in each of the months of July, August and September 2021. The cumulative effect of this was a 20 percent rise in real house prices between February 2020 and September 2021.
- Robust housing demand and more stagnant housing supply are both part of the explanation for the rapid house price inflation. Low interest rates during this period have made housing more affordable since this lowers the mortgage interest cost. The forced isolation and shift to working-from-home have also contributed to a demand for more living space. On the supply side, active housing listings (both existing home sales and new construction) have remained depressed, declining by more than 50 percent since the beginning of the COVID-19 pandemic. At the outset of the pandemic there was a shortage of construction workers and also of building materials. For example, the price of lumber more than doubled between February 2020 and May 2021 and, although the price has come down since, it remained 63 percent higher at the end of 2021 than just before the pandemic began. More generally, there has been a long-term trend of declining housing inventory. This decline continues despite the continued increase in new housing starts which, after a 40 percent decline between February and April 2020, recovered to pre-pandemic levels by the summer of that year and have exceeded these levels in the last two months of 2021.
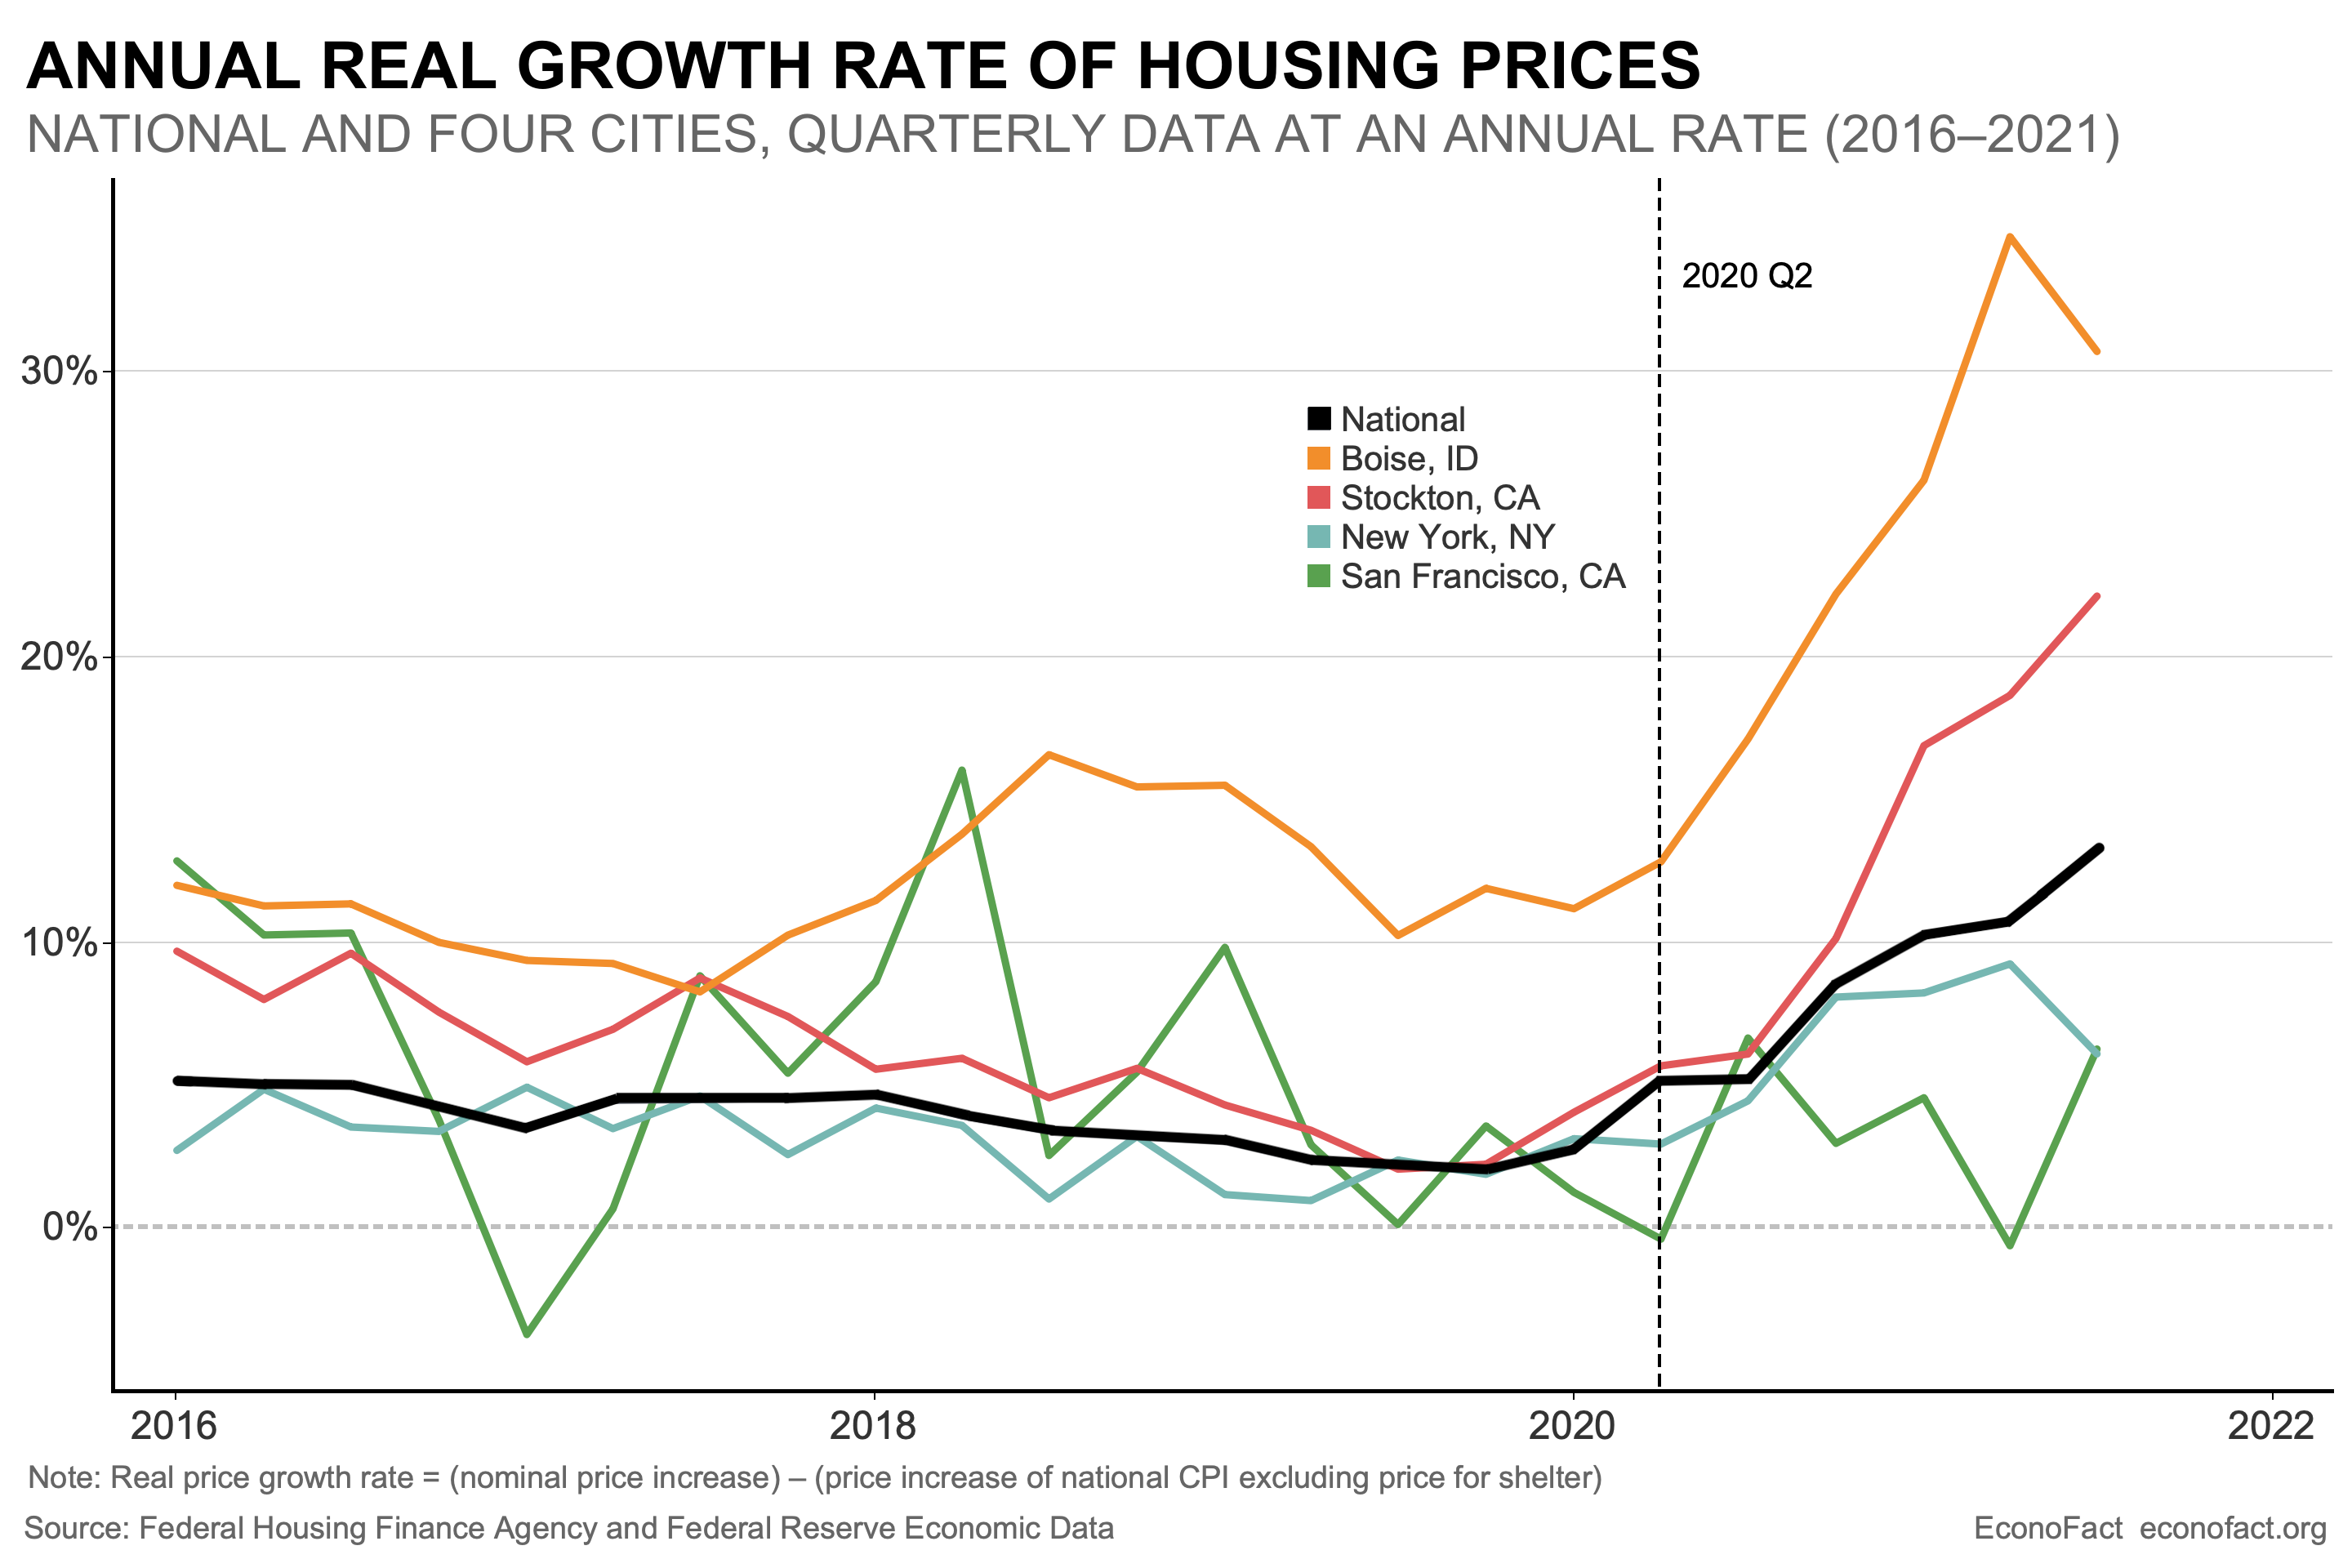
- Overall high house real price growth in the United States masks the dramatic variation across cities (see chart). In 2020, the real house price growth was 15.8 percent for Boise but only 6.5 percent for Stockton, 4.6 percent for New York and 2.6 percent for San Francisco. In the first three quarters of 2021 this rate almost doubled to 30.6 percent in Boise, almost tripled in Stockton to 19.2 percent, but rose much less in New York (7.9 percent) and San Francisco (3.4 percent). Part of this differential reflects differences in demand as people working from home looked for more space and moved to exurban areas and smaller cities or left cities for other reasons related to quality of life and perceived health benefits due to the COVID-19 pandemic.
- Beyond pandemic-related shifts in demand, a decades-long decrease in the number of housing starts per household has contributed to limited housing supply. The last peak in housing starts was September 2005, when the number of households was much smaller than today. The average number of housing starts per household averaged about half as big between 1990 and 2020 than in the three decades before that. Freddie Mac has estimated that the housing shortage was 3.8 million units by the end of 2020. An increase in land-use restrictions may be the main reason why housing inventory has been so low in the last 30 years.
What this Means:
High real house price growth rates have important distributional consequences, with existing homeowners enjoying large increases in wealth while prospective buyers finding themselves frozen out of the market. One source of the recent high real rate of growth in house prices is the increased demand in exurban areas and smaller cities as remote work becomes more widely accepted. But a longer-horizon reason is the limited supply of housing. Recent efforts to reverse this and limit single-family zoning, as in Minneapolis, Oregon, and California, have been limited in scope and have faced significant resistance from current homeowners. Many more regional or state-wide actions such as the affordable housing inventory law 40B in Massachusetts that requires that cities and towns have a minimum of 10% affordable housing and the Mt. Laurel doctrine in New Jersey that prohibits land use restrictions that limit affordable housing for poor households are needed to seriously address this housing supply shortage problem.